M&G History of the JSE Infographic: 1950 - 2021
Graphic Design
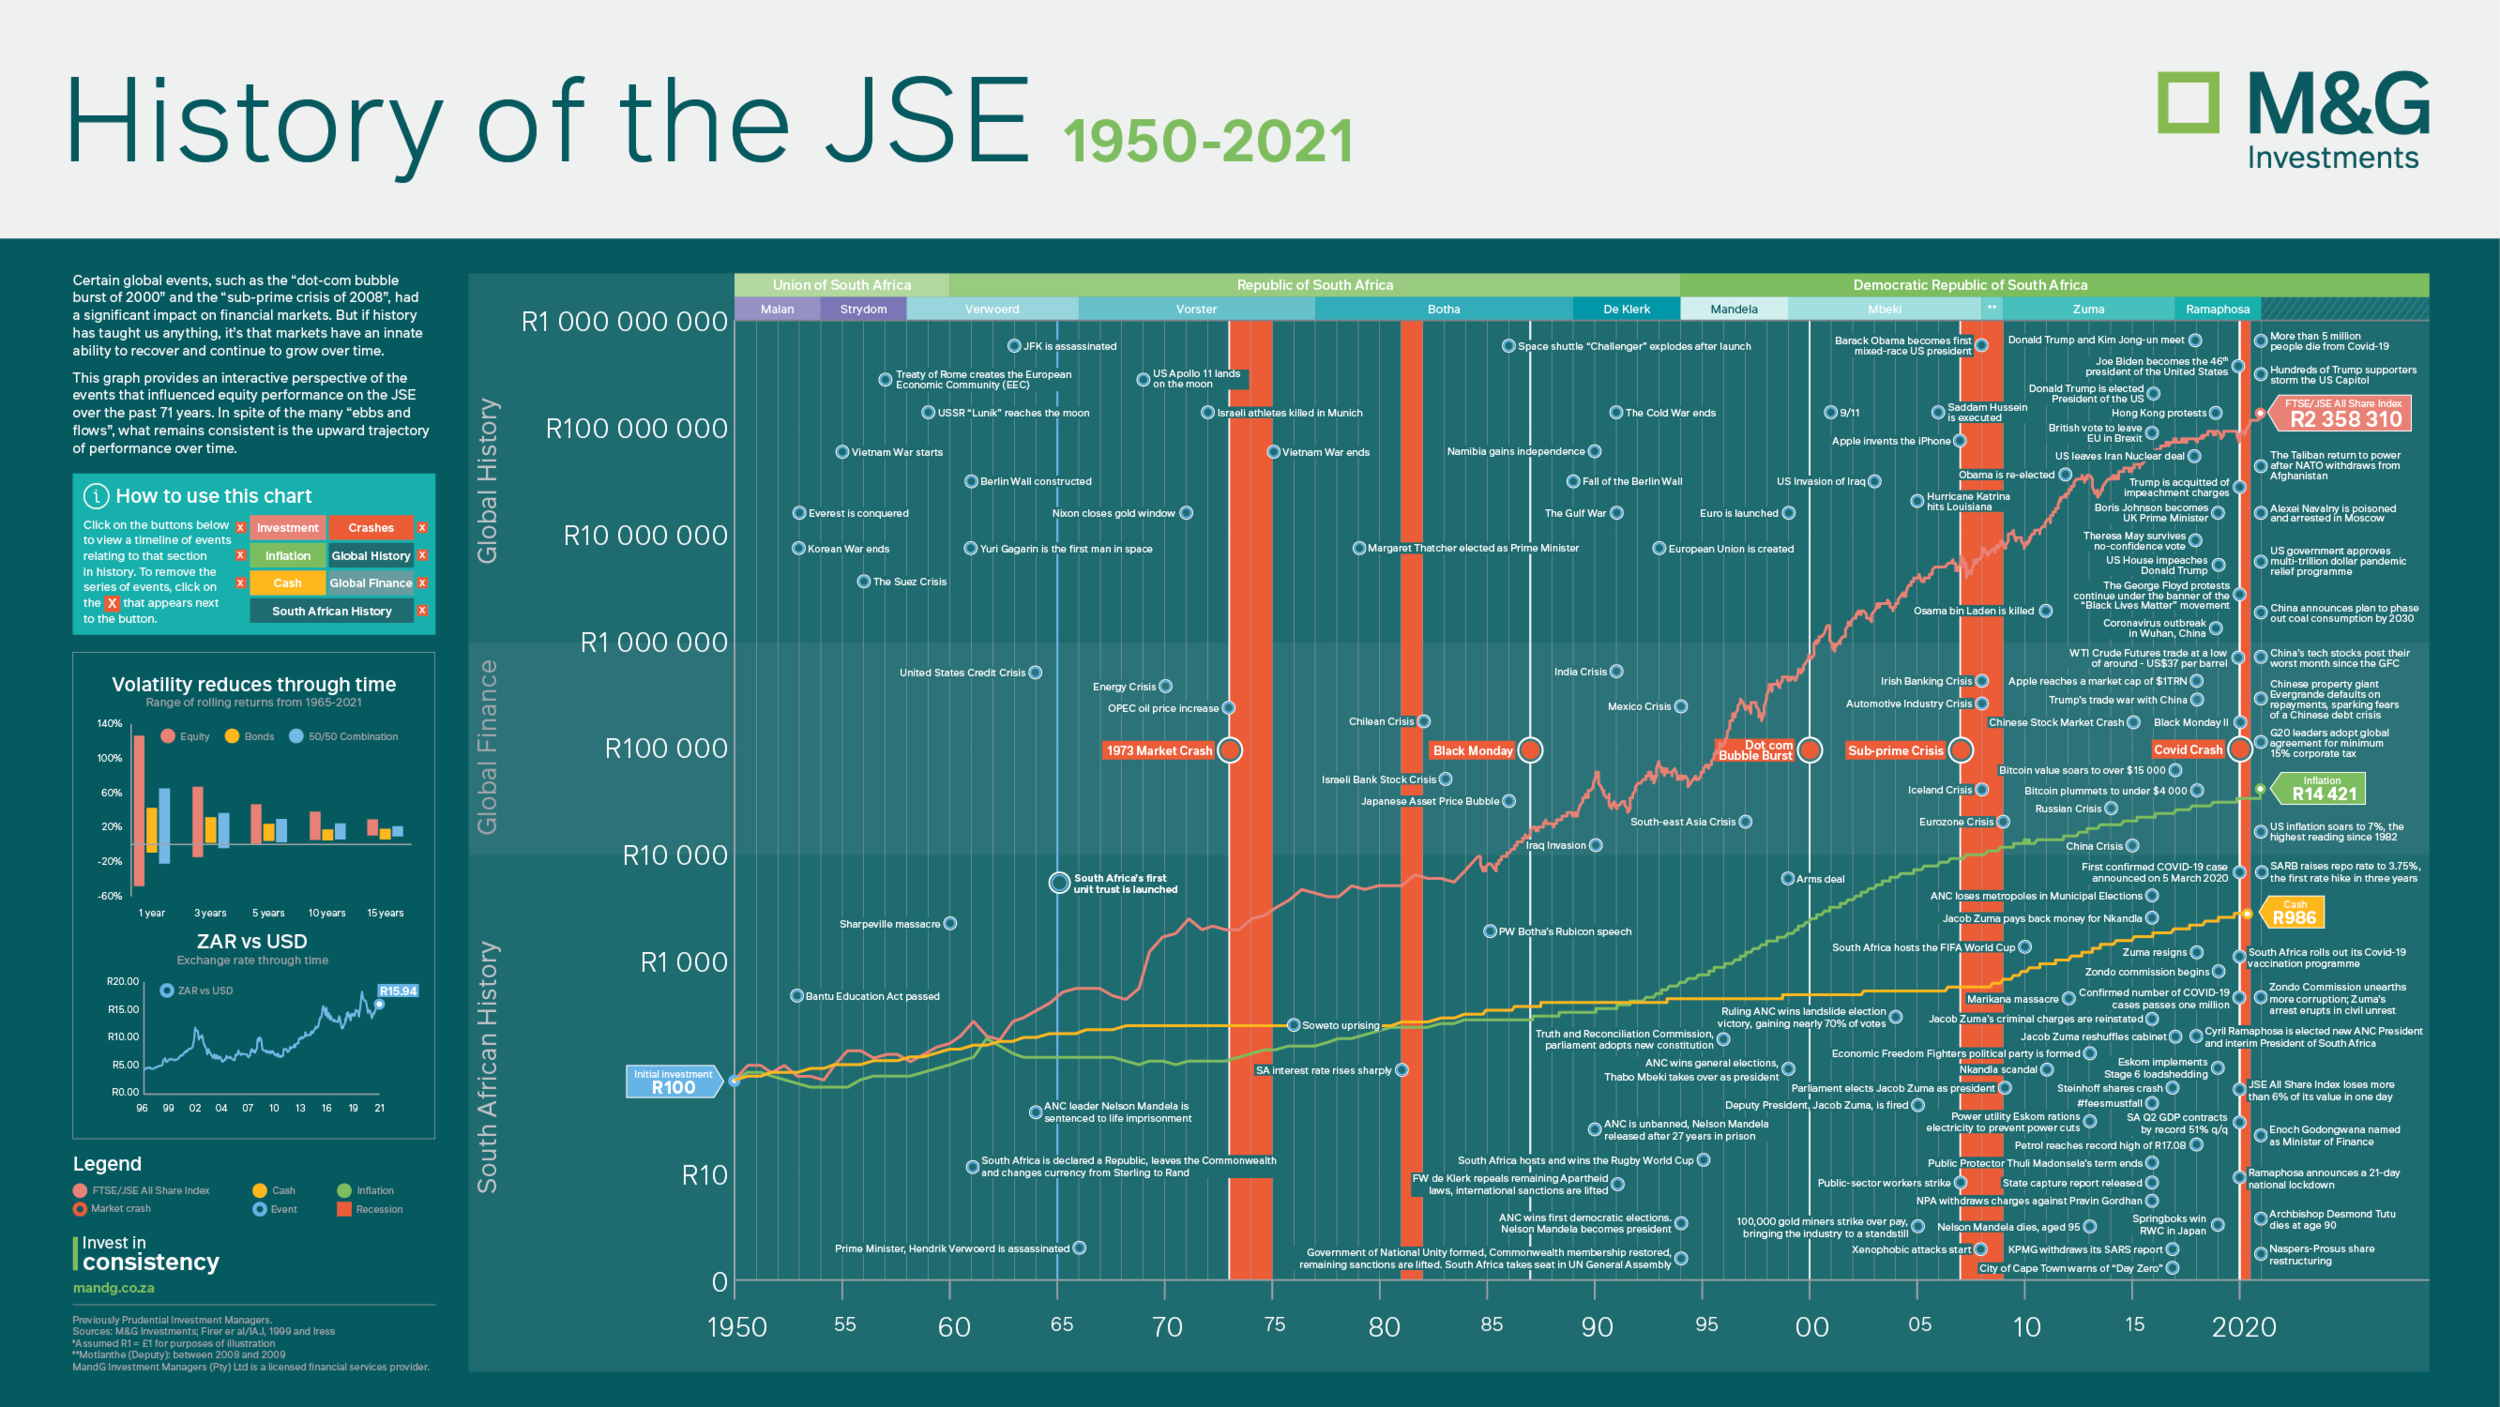
This chart* takes 70-years of (known) data and showcases – in a line graph form – how historical local and global events affected market movements of the Johannesburg Stock Exchange. Once a stagnant, uninspired, linear sales tool; I transformed it into a dynamic, informative, easy to digest interactive infographic that is now the most sought-after document by our clients. So much so that some of them have asked for framed versions to be hung in their offices.
The data contained in it illustrated by the upward trajectory of the white line functions as long-term proof that markets are innately volatile and the best investment strategy is to stay invested for as long as possible – time in the market vs timing the market. This is made even clearer by the primary sentiment the chart showcases: what would have happened to your cash if you had invested R100 in the market in 1950.
Client: M&G Investments
Website: https://www.mandg.co.za
Type: Interactive Infographic
Year: 2022
Capacity: Graphic Designer
*This infographic is best viewed in Adobe Reader and not in a native web browser to benefit from its interactive PDF features.
Digital version
Click image to view high-resolution PDF
Print version

Click image to view high-resolution PDF